
THE SHORT ANSWER
A percentile is a comparison, not a prediction
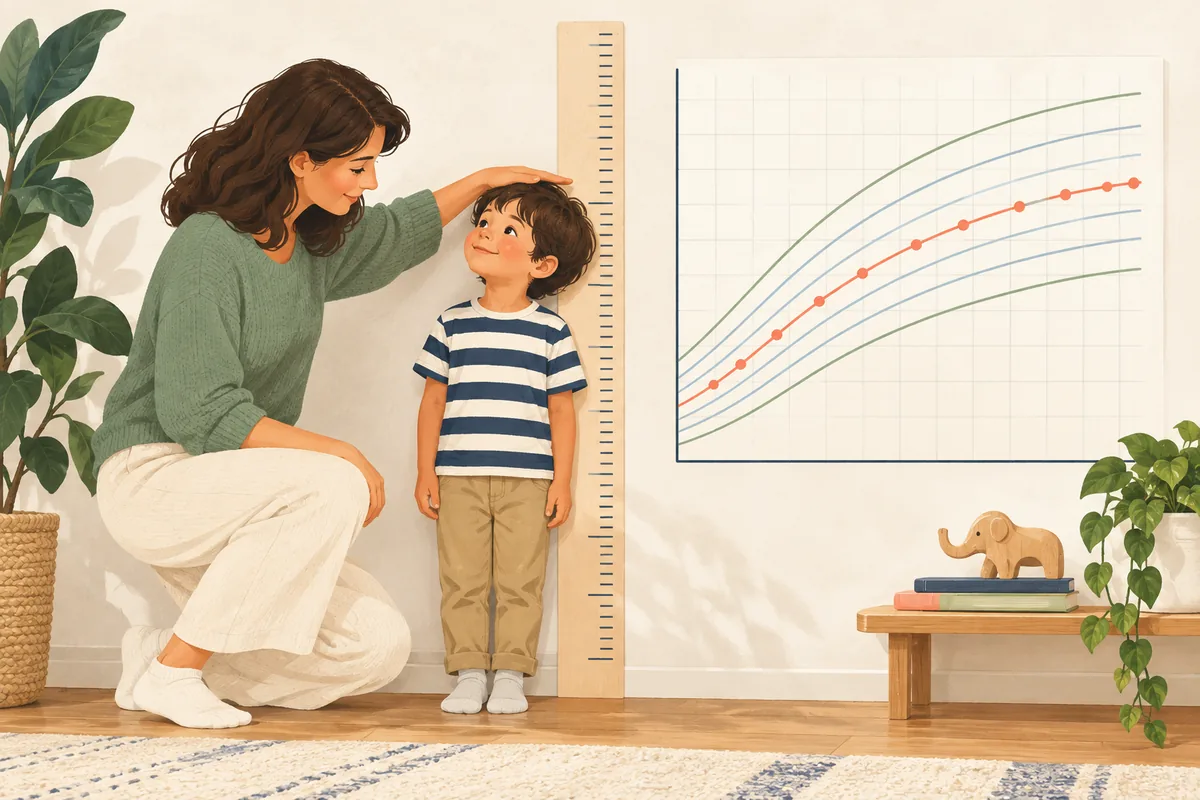
A height percentile says where a child's current measurement sits among a reference group of children who share the same age and sex. A result near the 60th percentile means the measurement is above roughly 60 out of 100 reference children, not that the child will be 60 percent as tall or that the number is a grade.
The adult-height calculator on HeightLab answers a different question: it uses two parent heights to produce a rough target-height estimate. Use the calculator for a transparent family estimate, and use a named growth chart for a child's current growth position. Neither result diagnoses a condition or guarantees final adult height.
Try the adult height calculator01 / THE MEANING
What a height calculator can tell you about percentiles
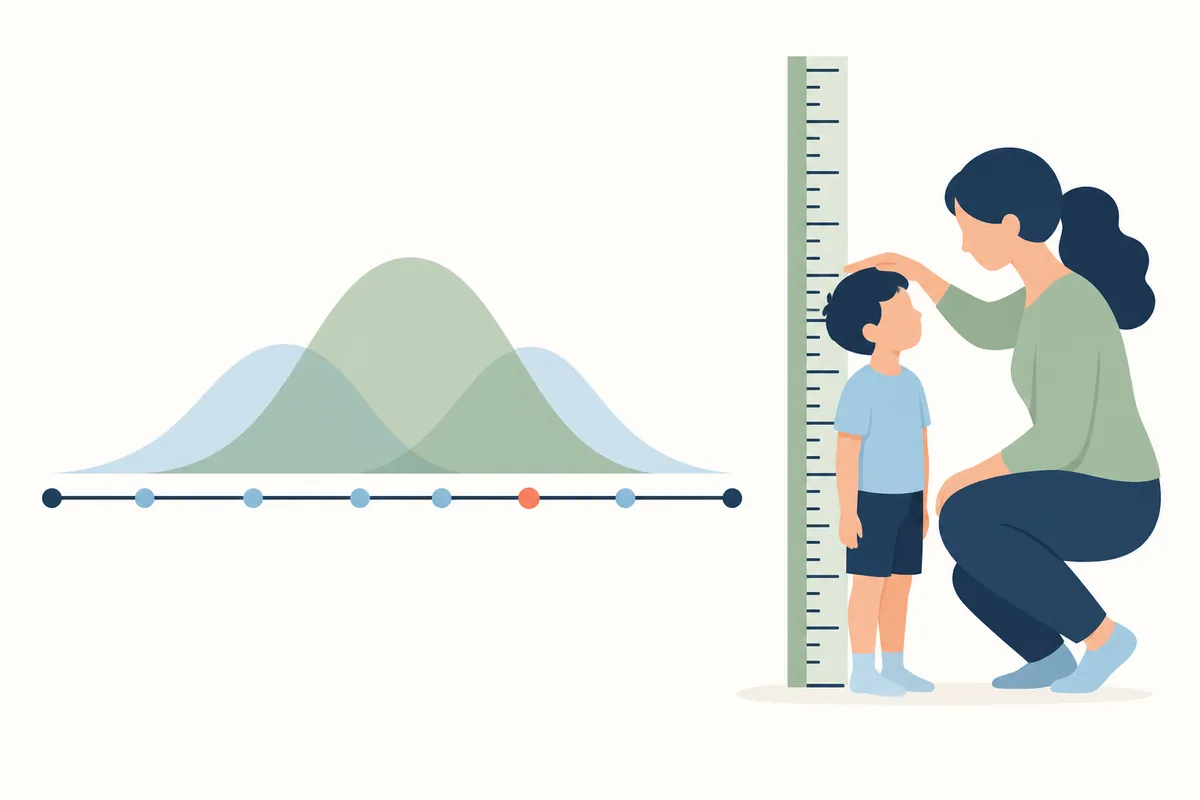
A percentile is a position on a distribution. Imagine lining up many children of the same age and sex from shortest to tallest. The 50th percentile is the middle of that reference group. A child at the 25th percentile is taller than about one quarter of the reference group and shorter than about three quarters. The comparison is about the reference population at that age, not a promise about the child's future.
- Same age and sex reference: the comparison group must be defined.
- Current position: a percentile describes now, not final adult height.
- Trend over time: repeated measurements are more informative than one isolated point.
- No diagnosis: a percentile alone cannot explain why a child is tall or short.
| Displayed position | What it means |
|---|---|
| 50th percentile | The measurement is near the reference median for that age and sex. |
| 25th percentile | About 25 of 100 reference children are shorter, and about 75 are taller. |
| 90th percentile | About 90 of 100 reference children are shorter; it is not a health score. |
02 / THE REFERENCE
Choose the right growth reference before reading the number
Growth references are not interchangeable. The CDC publishes stature-for-age data for children and adolescents from 2 through 20 years in the United States. The CDC also publishes separate files for birth through 36 months. The American Academy of Pediatrics explains that early childhood charts and later charts answer different measurement questions, including recumbent length for infants and standing stature for older children.
- CDC stature-for-age references cover ages 2 to 20 years in the United States.
- WHO standards are often used for infants and young children and are not the same dataset.
- Birth-to-36-month records may use recumbent length instead of standing height.
- A page should disclose its chart, data version, age limits, and unit handling.
03 / A DIFFERENT QUESTION
Why a height calculator is not the same as an adult-height percentile
An adult-height calculator estimates a family target from two parent heights. The mid-parental method averages those heights and applies a traditional adjustment. For example, 180 cm and 165 cm have a midpoint of 172.5 cm; adding about 6.35 cm for the boy option gives approximately 178.85 cm, commonly displayed as 179 cm. The calculation is transparent, but the range around it is broad.
| Tool result | Question it answers |
|---|---|
| Parent-height estimate | What rough adult-height target follows from two parent measurements? |
| Height percentile | Where does a current measurement sit among same-age, same-sex references? |
| Growth trend | Is the child's position reasonably consistent across repeated measurements? |
04 / INTERPRETATION
How to read one measurement without overreacting
Start by checking the input before interpreting the output. Confirm the child's age in years and months, the selected reference, and whether the height was taken without shoes. A difference of a centimeter or two can come from posture, a moving head, a soft floor, or rounding. A plausible-looking percentile is not proof that the measurement was collected correctly.
- Verify age, unit, posture, and chart before reading the result.
- Compare with earlier measurements made in a similar way.
- Treat a crossing trend or persistent concern as a reason to ask a clinician.
- Do not use one percentile for diagnosis, ranking, or treatment decisions.
05 / BETTER INPUTS
Record a height measurement that can be compared later
Use a firm, level floor and a flat wall. Remove shoes and bulky hair accessories, keep heels together when possible, and ask the child to look straight ahead. A right-angle book or height board can mark the top of the head more consistently than a flexible tape measure. Record the result in centimeters to one practical decimal place rather than inventing extra precision.
- Measure on a hard floor against a flat wall, without shoes.
- Keep the head level and the body relaxed instead of stretching upward.
- Use the same unit and method each time you compare measurements.
- Record date and age so a future trend has useful context.
06 / THE FORMULA
Where the mid-parental formula fits in a careful workflow
The formula is useful when someone asks for a quick family-based estimate. In centimeters, average the two parent heights, then add about 6.35 cm for the traditional boy adjustment or subtract about 6.35 cm for the girl adjustment. In inches, the same idea is often written as an adjustment of about 2.5 inches. The displayed result should be rounded for readability and paired with an approximate range.
| Input | Use it for |
|---|---|
| Two parent heights | A rough mid-parental adult-height target. |
| Age, sex, and current height | A height-for-age percentile on a named chart. |
| Dates and repeated readings | A growth trend that can be discussed with a professional. |
A SIMPLE ROUTINE
How to use a height calculator and percentile result responsibly
Use this sequence when you are combining a family estimate with a current growth measurement.
- Name the questionDecide whether you want a parent-based adult estimate or a current height-for-age comparison.
- Collect a clean inputMeasure without shoes, note the date and age, and keep units consistent.
- Check the sourceRead the chart name, age boundary, sex grouping, and data version before trusting a percentile.
- Read the patternCompare with earlier readings and discuss a persistent or changing pattern with a qualified professional.
COMMON QUESTIONS
Height calculator and percentile FAQ
These short answers keep the calculator, chart, and health limits in their proper roles.
Is a height percentile the same as an adult-height prediction?
No. A percentile describes a child's current position among a reference group. An adult-height prediction estimates a future target from parent heights or other methods.
Is the 50th percentile the ideal height?
No. It is the median of a reference group. Percentiles are not grades, and a range of steady growth patterns can be healthy.
Which chart should I use for a child under two?
Many systems use WHO standards and recumbent length for infants, while the CDC has separate birth-to-36-month files. Check the chart and measurement method rather than mixing values silently.
Can a height calculator diagnose a growth problem?
No. A calculator can show arithmetic or a chart position. Diagnosis requires a qualified professional to review measurements, growth velocity, family history, development, and health context.
How often should I measure a child's height?
Use routine health visits and a consistent method rather than repeated daily checks. A professional can suggest a useful interval when there is a specific concern.
Why did two percentile calculators give different results?
They may use different chart populations, age rounding, length versus standing height, units, or data versions. Compare the source and method before comparing the numbers.
Can I use the parent-height estimate for an adult?
The parent-based estimate is intended as a child's rough adult-height target. An adult with a measured height can use the site's converter for units, not for a prediction.
Where can I verify the reference data?
The CDC publishes growth-chart data files and the American Academy of Pediatrics explains percentiles and parent-height estimates. Links are listed below for direct review.
CHECK THE SOURCE
Official references for growth-chart context
These pages support the distinctions in this guide. They are educational references, not a substitute for care from a qualified professional.
- American Academy of Pediatrics: Understanding Growth ChartsExplains percentiles, z-scores, and why the trend matters more than one number.
- American Academy of Pediatrics: Predicting a Child's Adult HeightDescribes the mid-parental method and its rough margin of error.
- CDC Growth Charts Data FilesLists stature-for-age files, age ranges, LMS parameters, and percentile data.
Use the number as a starting point
A clear question, a repeatable measurement, and a named reference chart produce a more useful conversation than a single impressive-looking score.
Open the height calculator